Scenario
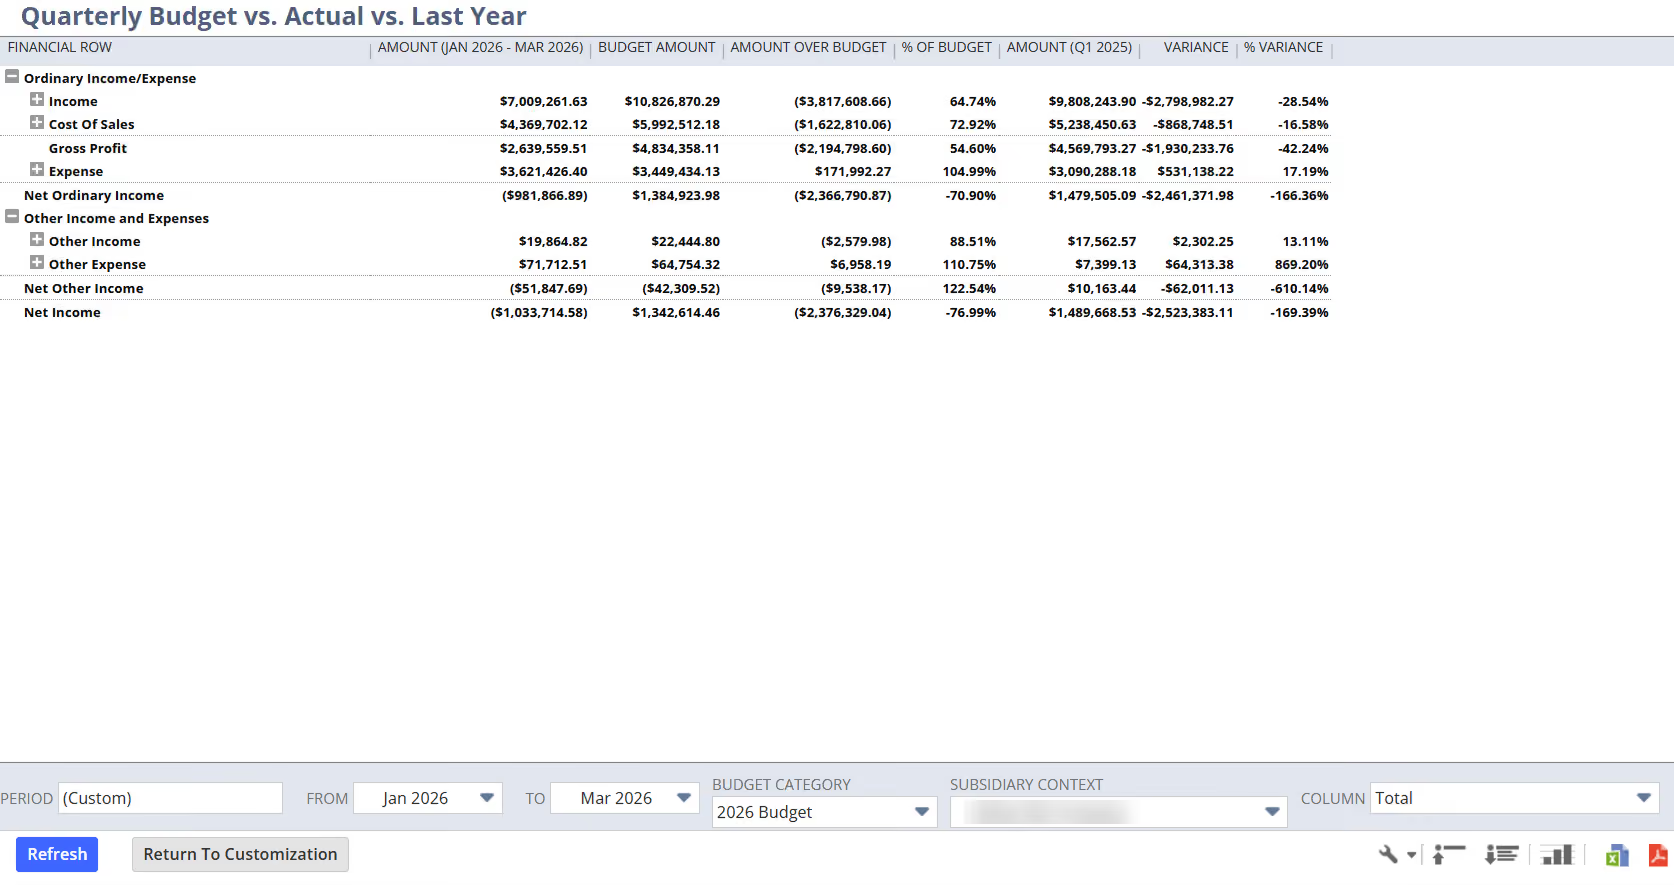
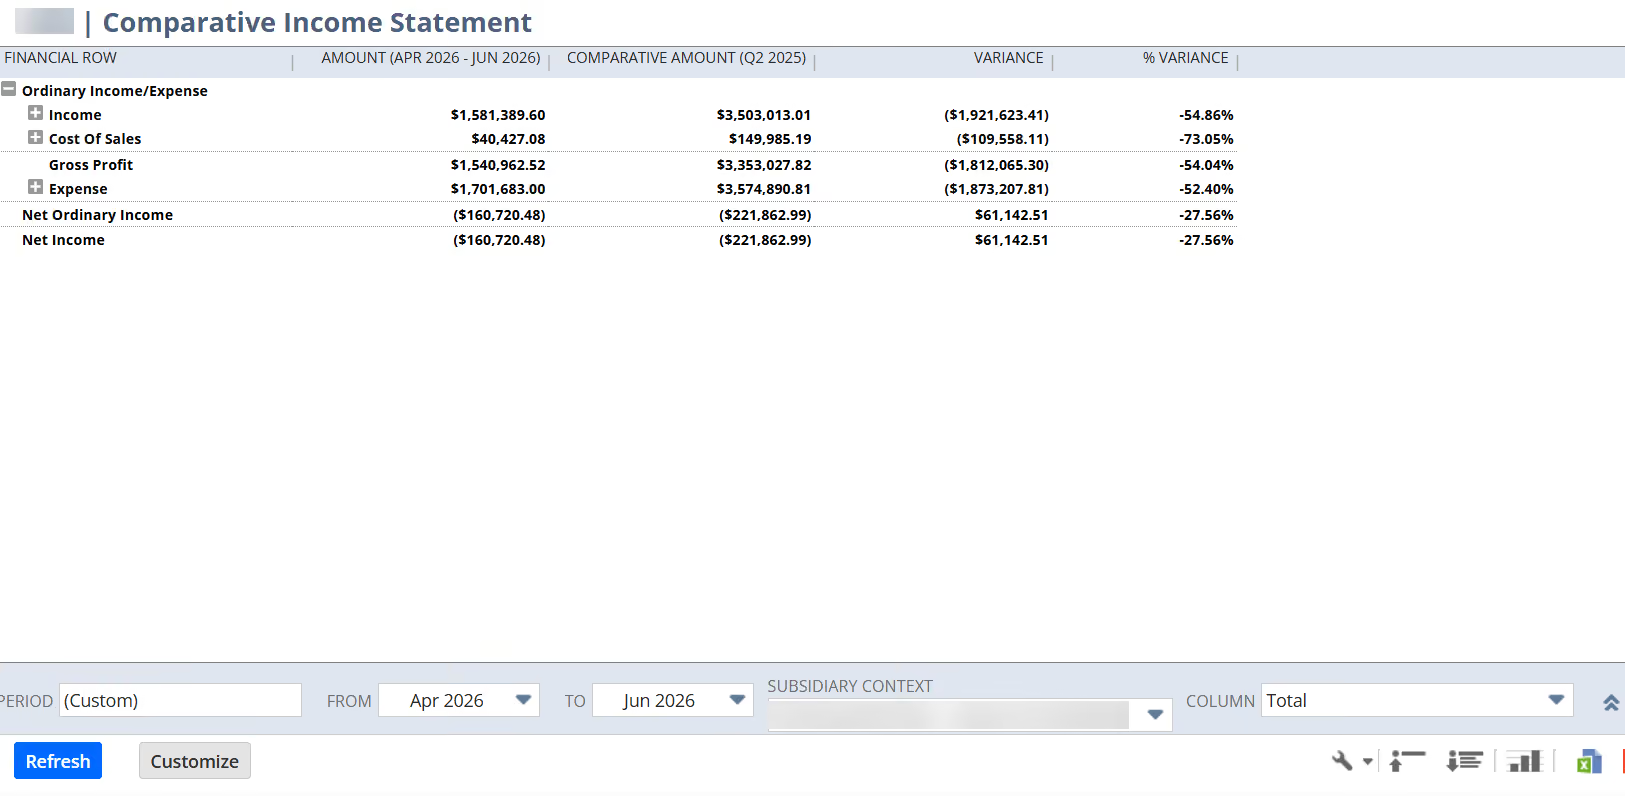
This article aims to guide users on how to customize the native Comparative Income Statement so that it performs a true year-over-year, quarter-versus-quarter comparison (as shown below).
By default, the native Comparative Income Statement always returns a full-year comparative amount, even when the current period is set to a single quarter. This means the comparison is only meaningful once the full year has closed, rendering it useless for quarterly analysis throughout the year. The steps below make the comparative column dynamic, so it matches whatever quarter is selected in the report against the same fiscal quarter of the previous year.
Solution
Below are the steps a user may follow:
I. Open and customize the Comparative Income Statement
- Navigate to Reports > Financial > Comparative Income Statement.
- Run the report once it displays, then click the Customize button (or go to Customize > Customize Summary) to open the Financial Report Builder.
II. Configure the comparative amount column
- In the Financial Report Builder, open the Edit Columns (Layout) section and select the comparative amount column — this is the column that displays the prior-period figure.
- Set the following in that column:
a. Show Grand Total — enable the grand total so the comparative figures roll up correctly.
b. Alternate Period Range Type — set to Relative to Report Date. This forces the column to respect the date range chosen in the report rather than using a fixed period.
c. Alternate Period Range — set to Same Fiscal Quarter Last Year. This tells NetSuite to take whatever period range is in the report and match it to the equivalent fiscal quarter in the prior year.
- Save the customized report (give it a clear name, for example, "Comparative Income Statement – Quarter vs Quarter YoY").
III. Run the report for a single quarter
- Open the saved customized report.
- Set the report date range to a single fiscal quarter (for example, Q1).
- The comparative column will now show the same fiscal quarter from the previous year, giving a quarter-versus-quarter, year-over-year comparison.
IV. Important notes and limitations
- This setup only works when the report date range is exactly one fiscal quarter. If the range is anything other than a clean quarter — for example, four months (January to April, which is one quarter plus an extra month) — the comparison will not align correctly.
- Always make sure the report date range matches a defined quarter before relying on the comparative figures.
V. Optional variations (monthly or yearly comparison)
The Alternate Period Range setting is what defines the comparative period, so it can be adjusted to compare a month or a year instead of a quarter:
- Monthly comparison — set Alternate Period Range to Same Period Last Year. With the report date range set to a single month, this compares, for example, January 2026 against January 2025 (it matches the one month beginning on the start date).
- Yearly comparison — this is effectively NetSuite's default behavior (full-year comparative), which is generally the least useful option during an open year.
For any organization serious about analytical rigor in its financial reporting, this customization is not a nice-to-have; it is the backbone of meaningful financial reporting. Whether the audience is executive leadership, auditors performing flux analysis, or SEC counsel drafting MD&A disclosures, the ability to compare current-quarter performance against the same period in the prior year is non-negotiable.