Scenario
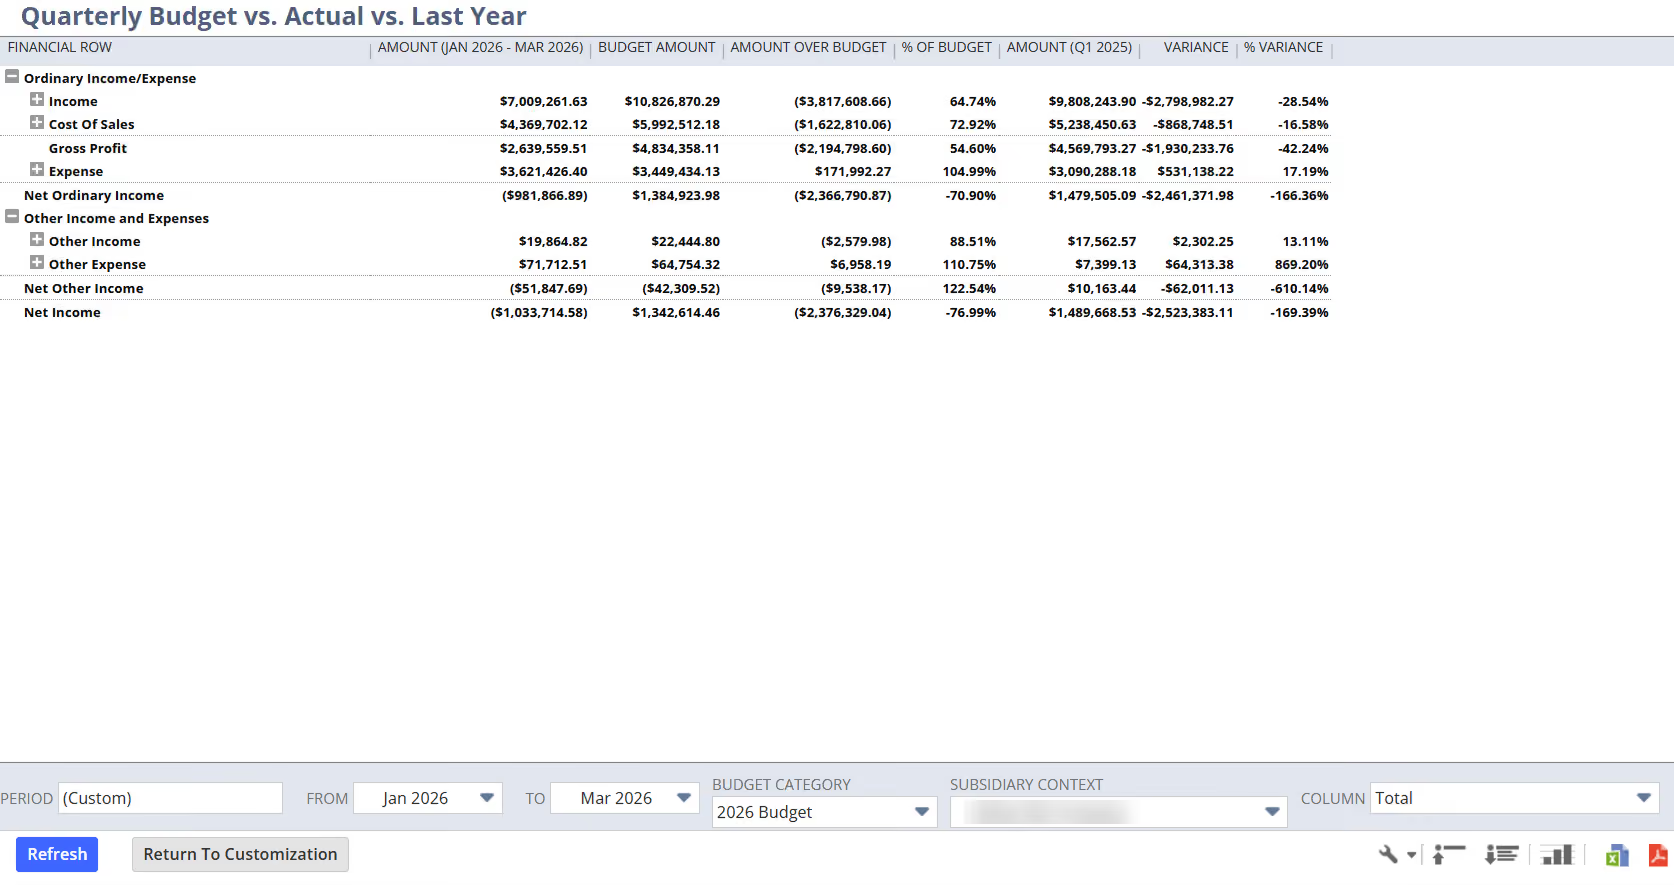
This article aims to guide users on how to customize the Budget vs. Actual report to add a year-over-year, quarter-versus-quarter comparison (as shown below).
The native Budget vs. Actual report compares the current period's actuals against the budget, using the standard columns: Actual (for the quarter), Budget, Amount Over Budget, and Percent Over Budget. These columns only measure performance against the budget. While NetSuite's native reports can compare budget to actuals or different timeframes individually, they lack a unified view for comprehensive analysis. By adding a prior-year same-quarter actual column and variance columns, the report can also show how the current quarter's actuals compare against the same quarter of the previous year, along with the resulting variances.
Solution
Below are the steps a user may follow:
I. Open and customize the Budget vs. Actual report
- Navigate to Reports > Financial > Budget vs. Actual, or open your existing saved Budget vs. Actual report.
- Confirm the native columns are present: Actual (for the quarter), Budget, Amount Over Budget, and Percent Over Budget.
- Click Customize to open the Financial Report Builder.
II. Add the prior-year, same-quarter actual column
- In the Edit Columns (Layout) section, add a new column based on the actual amount.
- Give the column a clear label, for example, as "Amount Q1 2025".
- Configure the column so it pulls the prior year's matching quarter:
a. Alternate Period Range Type — set to Relative to Report Date, so the column respects the date range chosen in the report.
b. Alternate Period Range — set to Same Fiscal Quarter Last Year, so the column returns the actual amount from the equivalent fiscal quarter of the previous year.
This makes the column dynamic: whatever quarter the report is run for, this column shows the actuals from the same quarter one year earlier.
III. Add the variance columns (formula columns)
The report is enhanced with variance columns that compare the current-year quarter against the prior-year quarter. These are formula columns.
1. Add a formula column for the Amount Variance:
a. Build the formula as the current-year actual minus the prior-year same-quarter actual (the column added in Step II).
b. Apply the formula to the grand total so the variance rolls up correctly.
c. Set the number formatting so negative values display in parentheses.
1. Add a formula column for the Percent Variance:
a. Build the formula as the difference between the current-year actual and the prior-year actual, divided by the prior-year actual.
b. Format the column as a percentage and apply the formula to the grand total.
IV. Save and run the report
1. Save the customized report with a descriptive name, for example, "Budget vs. Actual – with YoY Quarterly Comparison."
2. Run the report for a single fiscal quarter.
3. The report will now display the native columns (Actual, Budget, Amount Over Budget, % Over Budget) alongside the new columns: Actual – Same Quarter Last Year, Amount Variance, and Percent Variance.
V. Important notes
1. The year-over-year comparison relies on the same fiscal-quarter matching technique, so it only works correctly when the report date range is exactly one fiscal quarter. A range that is not a clean quarter will not align with the prior-year period.
2. The variance formula columns must be applied to the grand total for the totals row to calculate correctly.
3. With parentheses formatting enabled on the Amount Variance column, negative variances appear in parentheses rather than with a minus sign.